Appearance
Get Started
Welcome to CSV Plot! This guide will walk you through the simple process of creating beautiful visualizations from your data.
1. Prepare Your Data
Data Format Requirements
- Your data should be in CSV (Comma Separated Values) format
- First row must contain column headers
- Data entries should start from the second row
- File size and dimensions must comply with your subscription plan
For detailed specifications, see our Data Requirements Guide.
Converting to CSV
Already have CSV files? Skip to the next section.
For other formats (like Excel):
- Open your file in the source application
- Click
File→Save As - Select
CSV UTF-8 (Comma delimited) (*.csv)as the file type - Save your file
2. Create Your Visualization
Choose Your Data
- Navigate to home page
- Locate the dropbox in the center of the screen
- Drag and drop your CSV file
Map Your Data
Once your file is validated, you'll be taken to the data mapping interface where you can:
- Select columns for your visualization
- Configure chart parameters

Click "OK" when you're satisfied with the mapping settings.
3. Explore Your Visualization
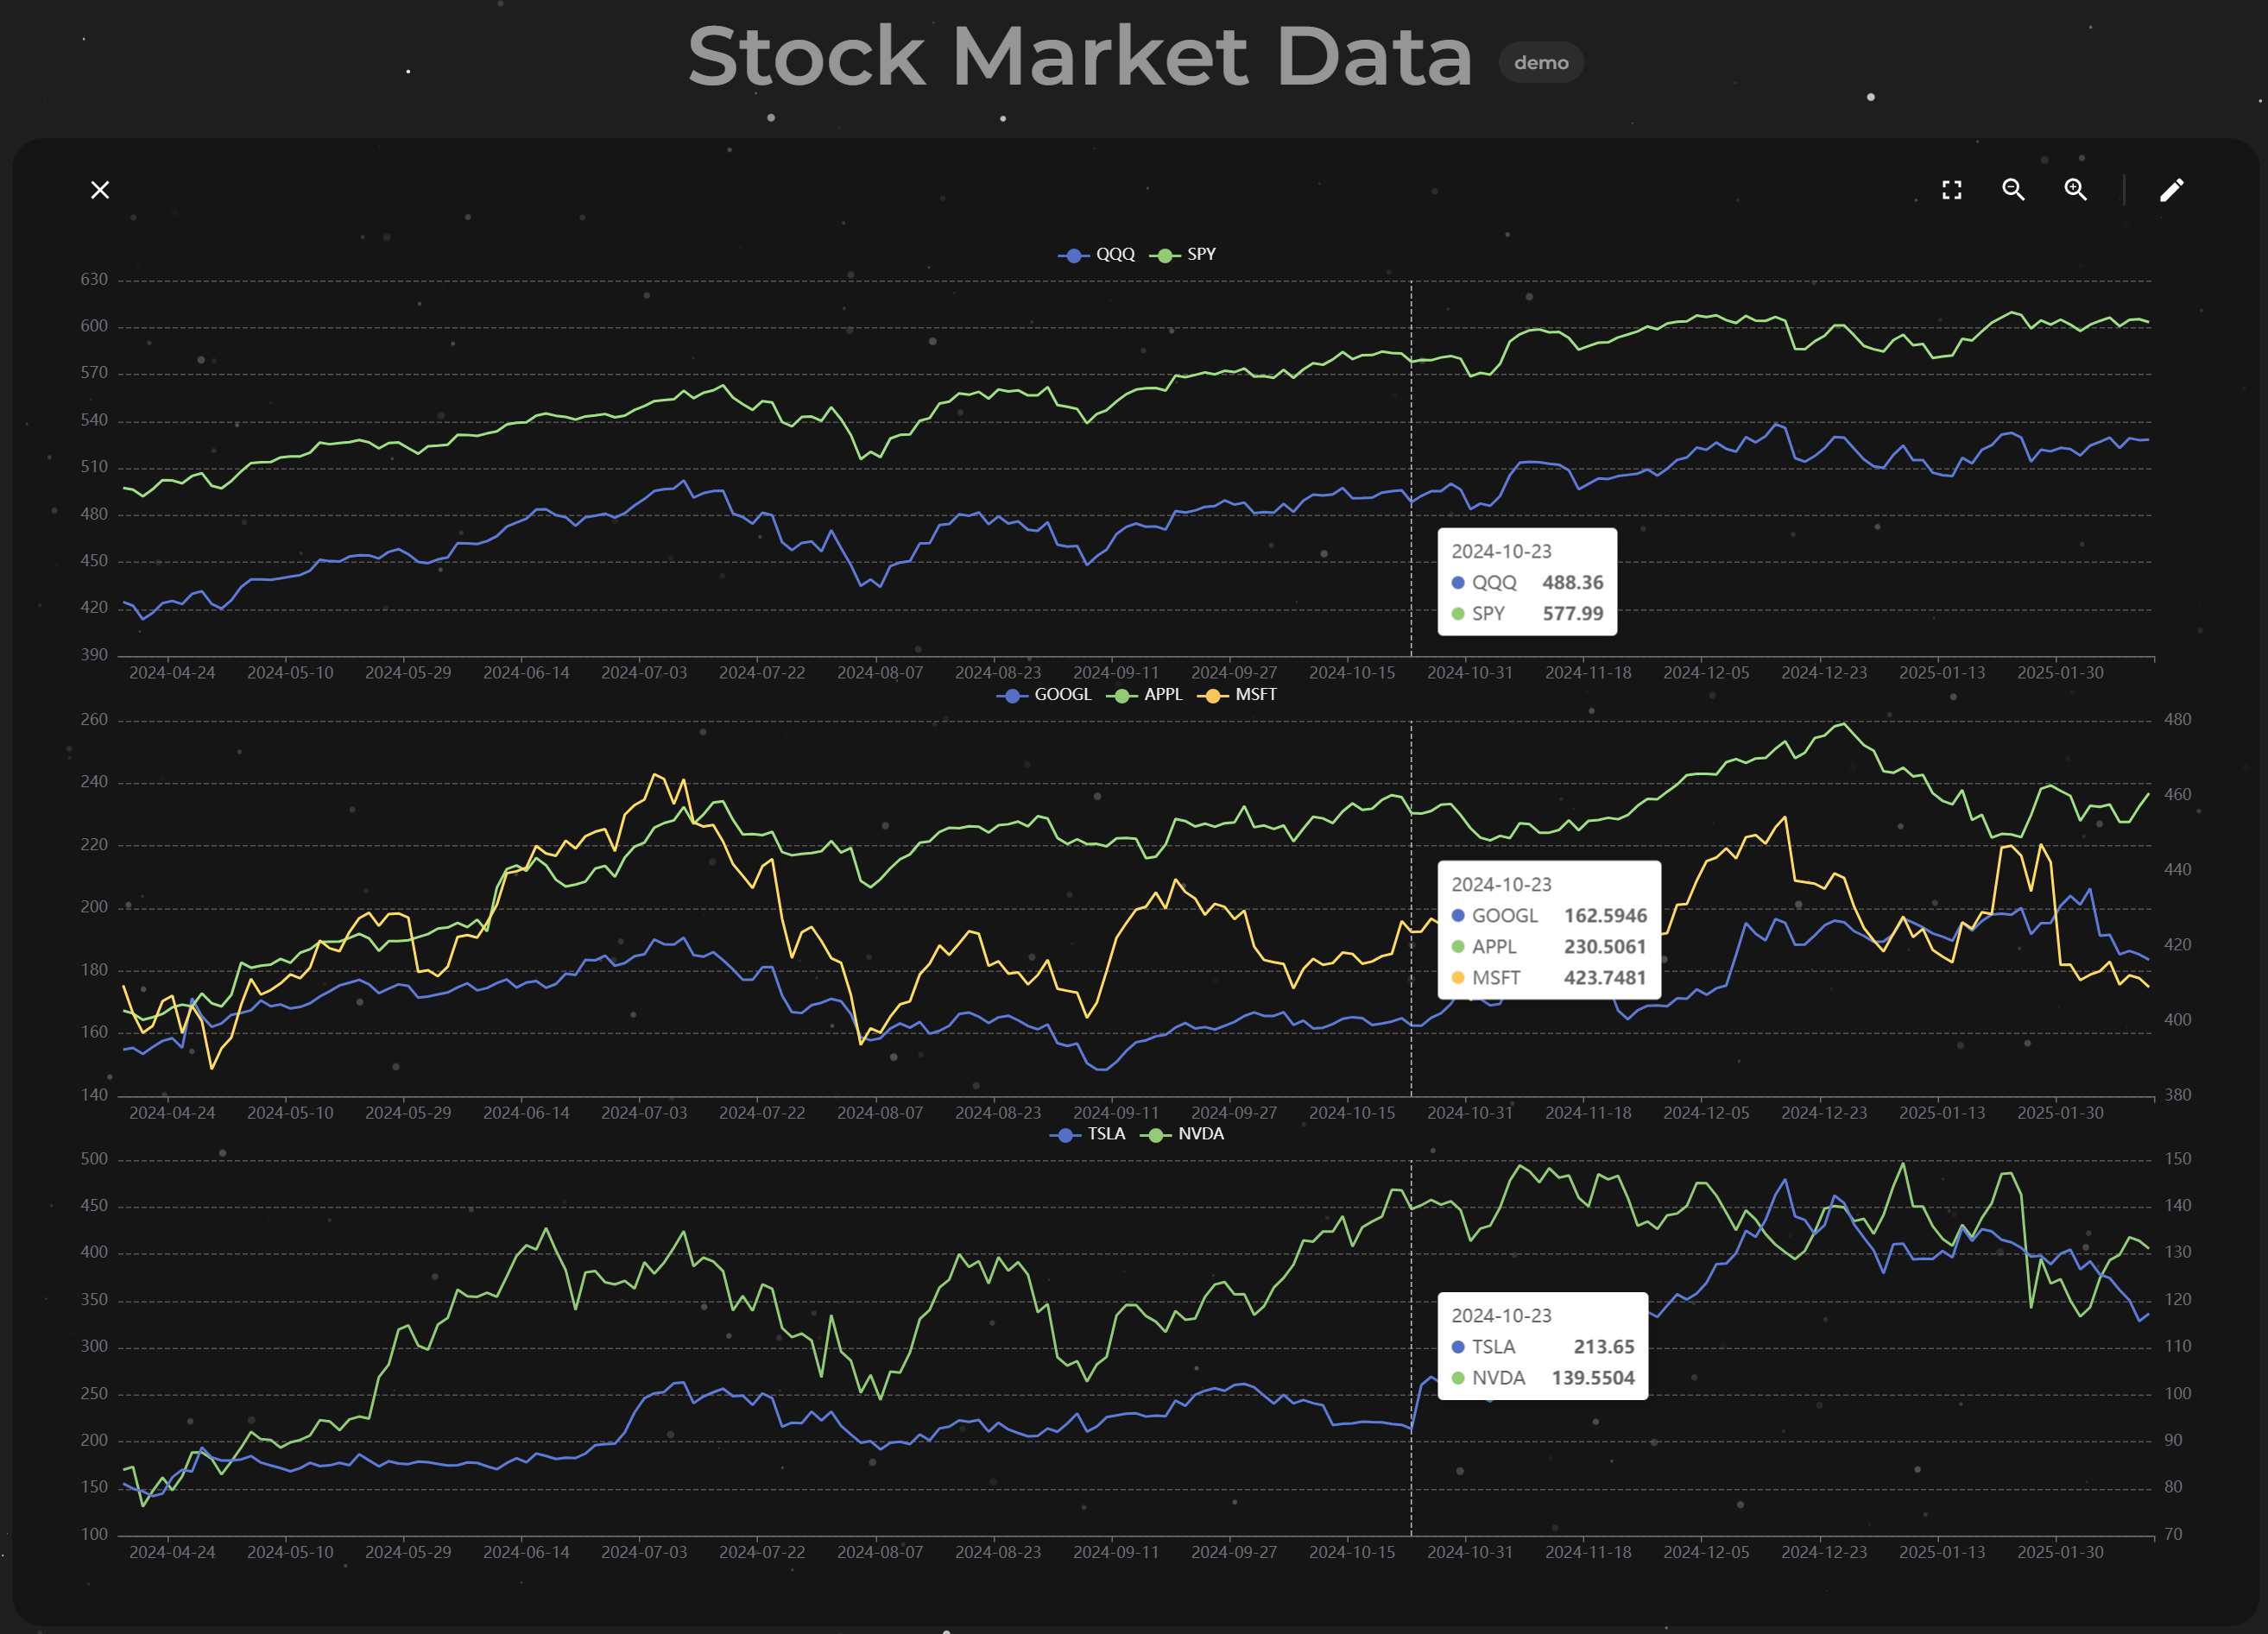
Your data will be transformed into an interactive visualization that you can:
- Zoom and pan
- Hide/Show columns temporarily
- Adjust chart size
- Share with others
